Linux Monitoring with Prometheus and Grafana Part 2

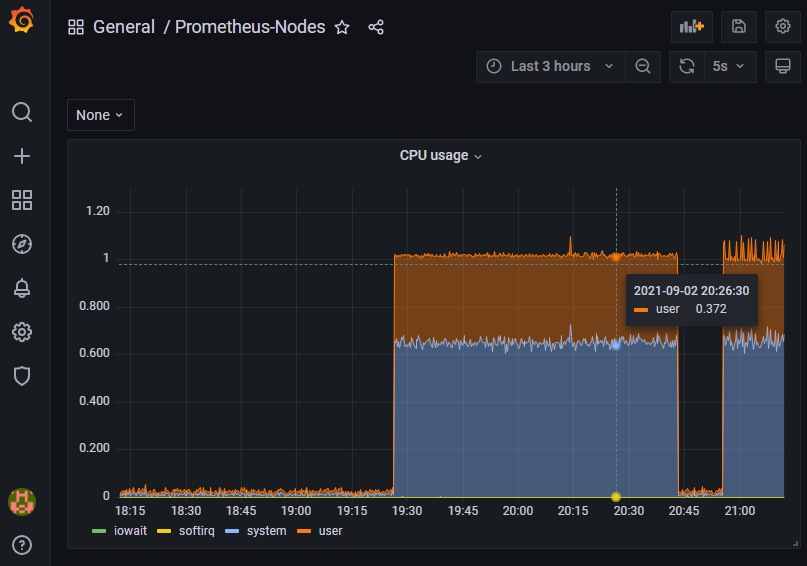
After setting up the Prometheus node exporter and the Prometheus instance in Part 1, the next part of the journey is to setup Grafana to be able to visualize and analyze the metrics that are being collected by Prometheus. >>
Linux Monitoring with Prometheus and Grafana Part 1

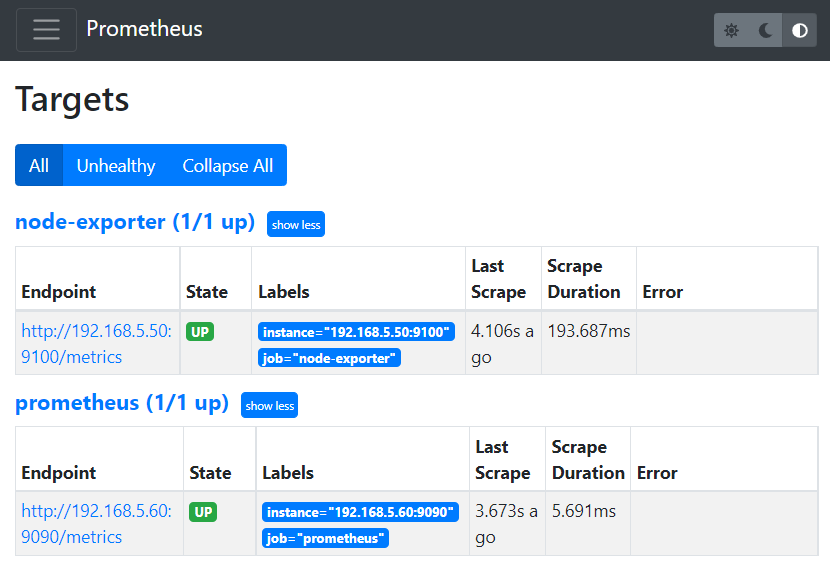
Now that I have setup a Linux server as a router/firewall, I want to monitor its CPU, memory, and disk usage and network traffic in real time. The first tool that comes to mind is Prometheus for collecting the metrics and Grafana for monitoring, analyzing and visualizing the metrics. This is a two part series. >>
Configuring a Raspberry Pi 4 as a Router

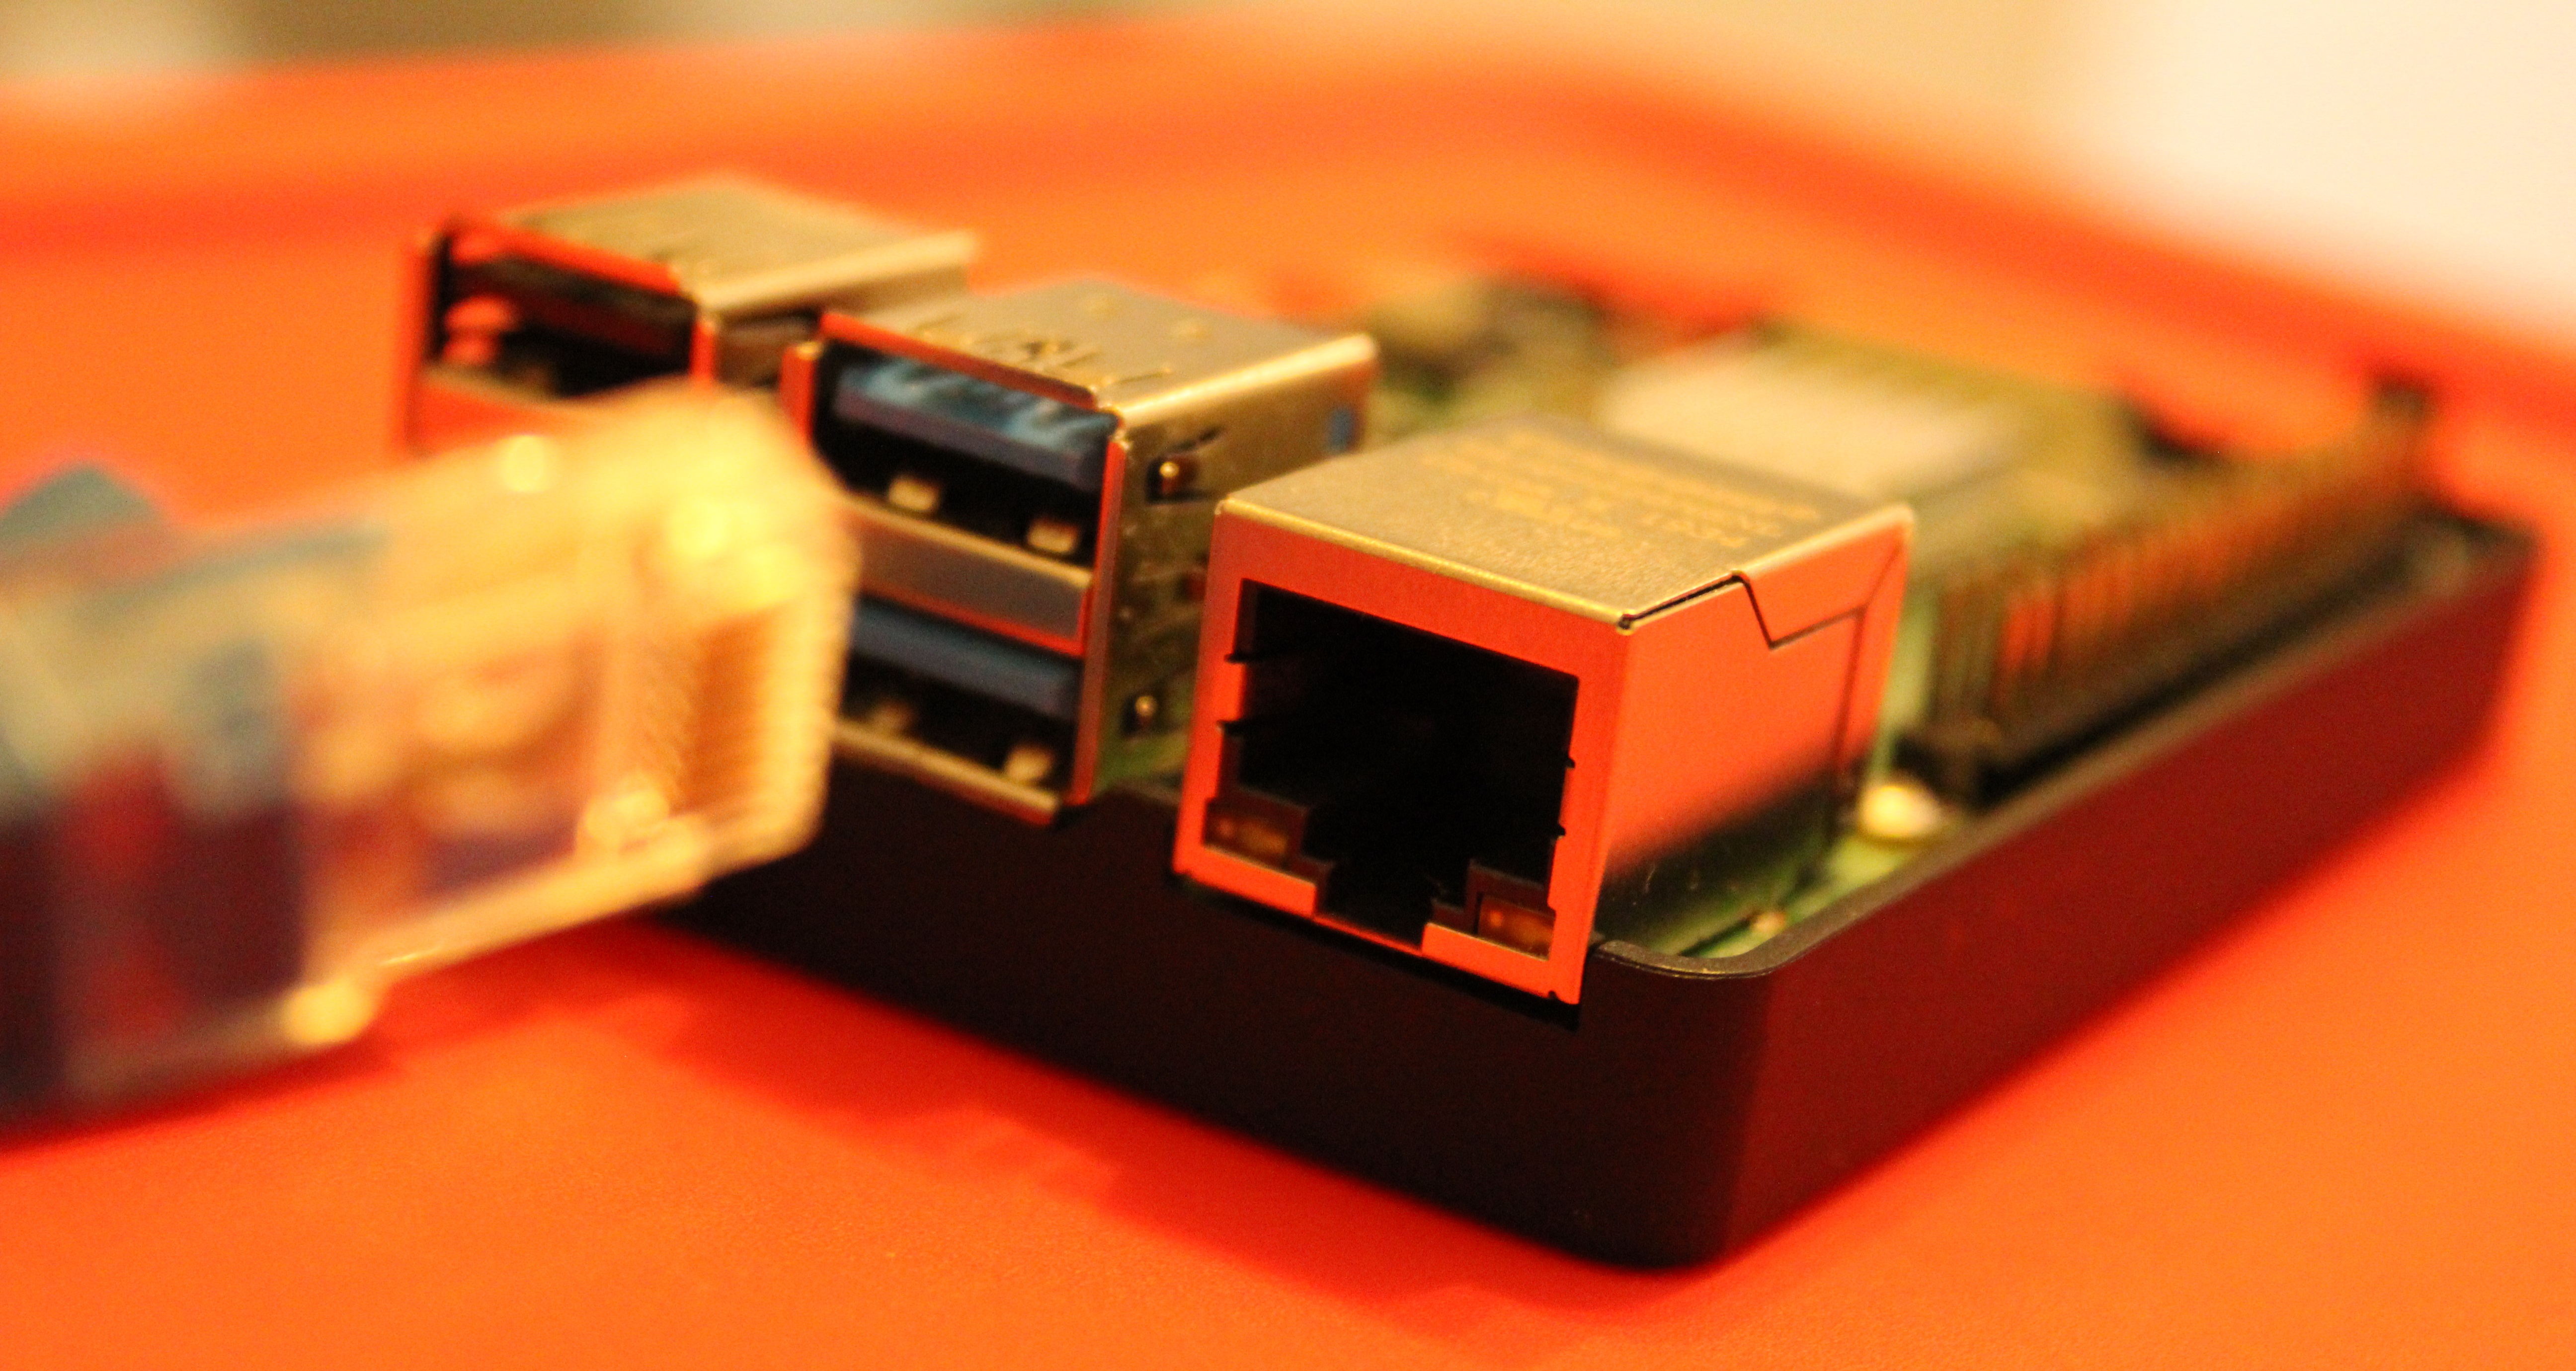
Recently, I ran into a situation that I needed to move my whole computer setup to another room. The only issue with this was that I have a IP phone that needs to be connected through an ethernet cable to connect to the Internet. This will have been fine if I were to run a cable all the way from one end of the apartment to the other end of the apartment, but I'm not a fan of having cables all over the floor or also couldn't run it. >>
