Linux Monitoring with Prometheus and Grafana Part 1

Now that I have setup a Linux server as a router/firewall, I want to monitor its CPU, memory, and disk usage and network traffic in real time. The first tool that comes to mind is Prometheus for collecting the metrics and Grafana for monitoring and visualizing the metrics.
There are few key reasons why I decided to go with these tools. First and most important is that both tools are open source. Both offer great flexibility, a lot of resources and active community, and, in addition, the cost is kept to a minimum (however, I still encourage you to pick an open-source project and contribute it). In Prometheus' case, it has so many third-party exporters for many different systems, and you can even write your own exporters that can integrate with Prometheus. In the case of Grafana, it already has a data source for Prometheus, and in addition, it is very flexible when it comes to visualizing and analyzing the metrics in the sense that you can query the metrics and visualize them the way that you think it is best to help you get the insights of what it's happening in your environment(s).
Getting Started
There are a few things that are needed before starting. For this, I will be reusing the setup that I did with the Raspberry pi which is running Ubuntu Server 20.04 LTS (however, Prometheus can be setup in/with AWS EC2, a local virtual machine, or even your containerized applications).
In addition, we will need another computer that will be setup as the Prometheus and Grafana server. Note that measurement needs to be taken to secure the communication between the Prometheus node exporter, Prometheus, and grafana.
Prometheus is composed of two components. You have the Prometheus Exporter and the Prometheus (instance).
Setting up the Prometheus Node Exporter
The Prometheus Exporter that I will be using is the Node/system metrics exporter. This node exporter gathers hardware and OS metrics which is going to be sent to the Prometheus server. Because the node exporter is being setup as a service, I am creating a service account and a service for it.Before continuing further, the prometheus_exporter service account needs to be created, as follow:
sudo useradd --no-create-home --user-group --uid 240 --shell /bin/false prometheus_exporter
Note: I am setting the uid lower than 1000, but you can omit this (--uid #). However, if you want to use a uid lower then 1000, I
will recommend checking if the uid is available in your Linux system. You can run the following command to check for already
in used uid in the /etc/passwd:
sudo cat /etc/passwd | awk -F':' '{print $3}' In addition, since no one will be logging into the service prometheus_exporter service account, it is best to lock it, as follow:
sudo usermod -L prometheus_exporter To download the Node Exporter for, type the following command into the terminal (note, node exporter's version that I am using is node exporter version 1.2.2 for the arm64 architecture) - you can download different Prometheus' exporters from:
https://prometheus.io/docs/instrumenting/exporters/
In the following steps, I will go through the setup of the node exporter in the system that is being monitored.
Run the following command to download the Prometheus node exporter, change into its directory, and then extract it:
wget https://github.com/prometheus/node_exporter/releases/download/v1.2.2/node_exporter-1.2.2.linux-arm64.tar.gz -P ~/prometheus_exporter
cd ~/prometheus_explorer/
tar -zxvf node_exporter-1.2.2.linux-arm64.tar.gz
Once the file has been extracted, change into it, and then copy the node_exporter file into /usr/local/bin/:
cd node_exporter-1.2.2.linux-arm64/
sudo cp node_exporter /usr/local/bin/
The next step is to change the /usr/local/bin/node_exporter file's permission:
sudo chown prometheus_exporter:prometheus_exporter /usr/local/bin/node_exporter Then run the following command to create a service file which is going to be used to run the node exporter as a service
under the prometheus_account's account:
sudo nano /etc/systemd/system/node_exporter.service Type or copy/paste the following into the node_exporter's service file:
[Unit]
Description=Node Exporter
After=network.target

[Service]
User=prometheus_exporter
Group=prometheus_exporter
Type=simple
ExecStart=/usr/local/bin/node_exporter

[Install]
WantedBy=multi-user.target
After saving the service file, the Linux systemctl daemon needs to be reloaded, which can be done with the following command:
sudo systemctl daemon-reloadTo start the node_exporter service, enter the following command into the terminal:
sudo systemctl start node_exporterTo check its status, enter the following command into the terminal:
sudo systemctl status node_exporterOnce you know that the service is running fine, enable its service by enter the following command into the terminal:
sudo systemctl enable node_exporterFirewall Configuration
The following firewall configuration can be omitted if you are not setting up the Prometheus node exporter in the Linux router/firewall, but you might want to check if you still need to allow traffic through for TCP port 9100.
After the setup of the node exporter, we need to add a new firewall rule into iptables to allow TCP traffic on port 9100
for the node exporter metrics to be pulled by the Prometheus server. The only issue with this is that because we cannot
move the iptables' -A INPUT -j DROP rule down, it has to be deleted, the new rule added, and then -A INPUT -j DROP
re-added, as follow:
sudo iptables –L --line–numbers
sudo iptables -A INPUT -p tcp --dport 9100 -j ACCEPT
sudo iptables –D INPUT [DROP_Rule_Number]
sudo iptables -A INPUT -j DROP
After changing iptables, the following commands will save the new iptables configurations into the /etc/iptables/rules.v4
file in order to be permanent and not be lost if the system is reboot:
sudo iptables-save > /etc/iptables/rules.v4Refer to Configuring a Raspberry Pi 4 as a Router for more details regarding setting up iptables.
Finally, after setting up the node exporter, one way to verify that the node exporter is working is to use curl to check the node exporter's site as follow:
curl http://localhost:9100/metrics Note: this will also give a list of all the metrics that will be pulled by Prometheus.
Setting up the Prometheus Instance
In the following steps, I will go through process of setting up Prometheus (version 2.29.2 Amd64 architecture) to gather metrics from the node exporter(s). As in the case of the node exporter, a service account also needs to be setup for Prometheus, as follow:
sudo useradd --no-create-home --user-group --uid 230 --shell /bin/false prometheus
Note: I am setting the uid lower than 1000, but you can omit this (--uid #). However, if you want to use a uid lower then 1000, I will recommend checking if the uid is
available in your Linux system. You can run the following command to check for already in used uid in the /etc/passwd:
sudo cat /etc/passwd | awk -F':' '{print $3}' In addition, since no one will be logging into the service Prometheus' service account, it is best to lock it, as follow:
sudo usermod -L prometheus_exporter Run the following command to download Prometheus, change into its directory, and then extract it:
wget https://github.com/prometheus/prometheus/releases/download/v2.29.2/prometheus-2.29.2.linux-amd64.tar.gz -P ~/prometheus_server
cd ~/prometheus_server
tar -zxvf prometheus-2.29.2.linux-amd64.tar.gz
After extracting Prometheus, we need to change into it, as follow:
cd /prometheus-2.29.2.linux-amd64 The following steps will through the process of setting up the necessary directories, moving Prometheus' files into them, and changing their ownership to the Prometheus' service account
The following command will create a directory in /etc/ where the prometheus' configuration files will be saved:
sudo mkdir /etc/prometheus Next, the following command will create a directory in /var/lib/ where the Prometheus' data will be stored:
sudo mkdir /var/lib/prometheus The console_libraries, consoles, LICENSE, NOTICE, & prometheus.yml files will be copied into /etc/prometheus by running the follow commands into the terminal:
sudo cp -r console_libraries /etc/prometheus
sudo cp -r consoles /etc/prometheus
sudo cp LICENSE /etc/prometheus
sudo cp NOTICE /etc/prometheus
sudo cp prometheus.yml /etc/prometheus
In addition, the promtool & promtool files will be copied into /usr/local/bin/ by running the follow commands into the terminal:
sudo cp promtool /usr/local/bin/
sudo cp prometheus /usr/local/bin/
Next, the ownership of the /etc/prometheus & /var/lib/prometheus directories and /usr/local/bin/prometheus & /usr/local/bin/promtool
files need to be changed to the Prometheus' service account. Run the following commands to change the ownership of the directories and files:
sudo chown -R prometheus:prometheus /etc/prometheus
sudo chown prometheus:prometheus /var/lib/prometheus
sudo chown prometheus:prometheus /usr/local/bin/prometheus
sudo chown prometheus:prometheus /usr/local/bin/promtool
Then run the following command to create a Prometheus's service file which is going to be used to run Prometheus as a service under the Prometheus' account:
sudo nano /etc/systemd/system/prometheus.service Type or copy/paste the following into the Prometheus' service file:
[Unit]
Description=Prometheus
Wants=network-online.target
After=network-online.target

[Service]
User=prometheus
Group=prometheus
Type=simple
ExecStart=/usr/local/bin/prometheus \
    --config.file /etc/prometheus/prometheus.yml \
    --storage.tsdb.path /var/lib/prometheus/ \
    --web.console.templates=/etc/prometheus/consoles \
    --web.console.libraries=/etc/prometheus/console_libraries

[Install]
WantedBy=multi-user.target
After saving the service file, the Linux's systemctl daemon needs to be reloaded which can be done with the following command:
sudo systemctl daemon-reload To start the Prometheus' service, enter the following command into the terminal:
sudo systemctl start prometheus And to check its status, enter the following command into the terminal:
sudo systemctl status prometheus Once you know that the service is running and there is no error when checking its status, enable its service by enter the following command into the terminal:
sudo systemctl enable prometheus
The final step is to configure the Prometheus' prometheus.yml file located in the /etc/prometheus directory
with the targets' IP addresses, in this case the Prometheus server/instance and the Prometheus node exporter. Furthermore, the Prometheus server's IP
address is what is going to be configured in Grafana for the data source.
Enter the following to open the file with Nano /etc/prometheus/prometheus.yml confiration file:
sudo nano /etc/prometheus/prometheus.yml
After scrape_configs: type or copy/paste the following to change the default configuration
(note that anything following the # sign is just comments):
scrape_configs:

# Prometheus instance/server and the targets' IP and port are 192.168.5.60:9090
- job_name: "prometheus"

  static_configs:
    - targets: ["192.168.5.60:9090"]

# Prometheus Node Exporter system (Linux Router/Firewall), interval time set to 5 seconds, and targets' IP and port are 192.168.5.50:9100
  - job_name: 'node-exporter'
  scrape_interval: 5s
  static_configs:
    - targets: ['192.168.5.50:9100']
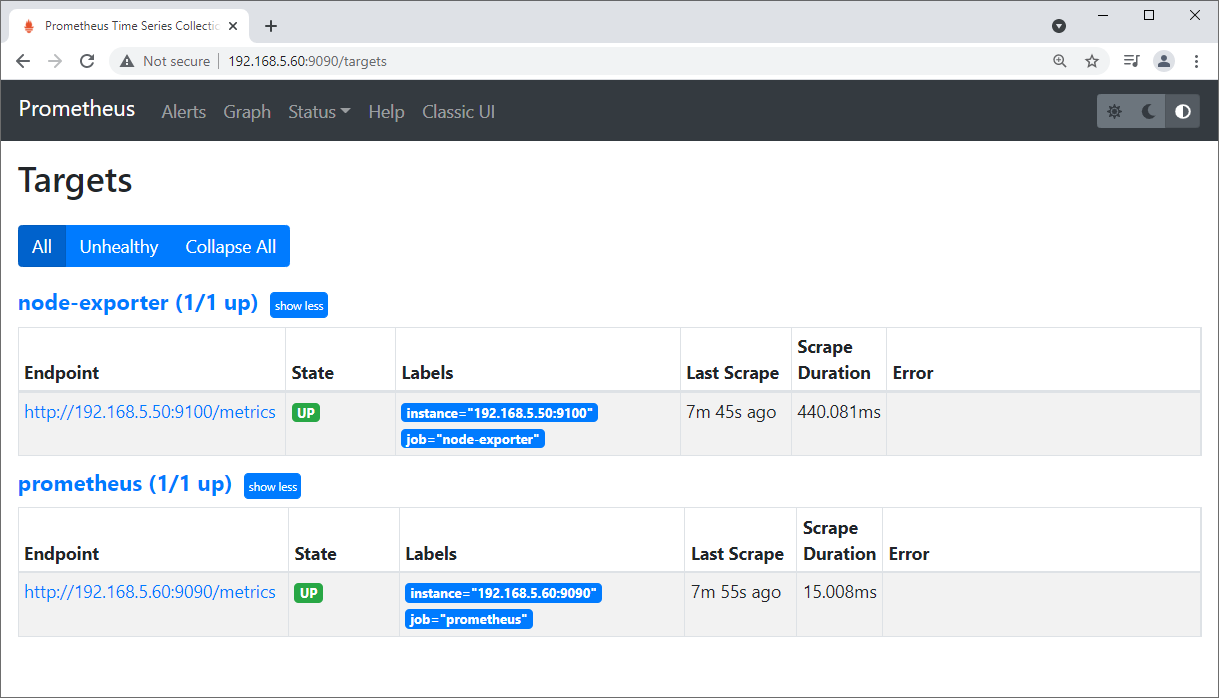
After saving the configuration in the /etc/prometheus/prometheus.yml file, you will be able to access the Prometheus
portal by entering the following in the browser:
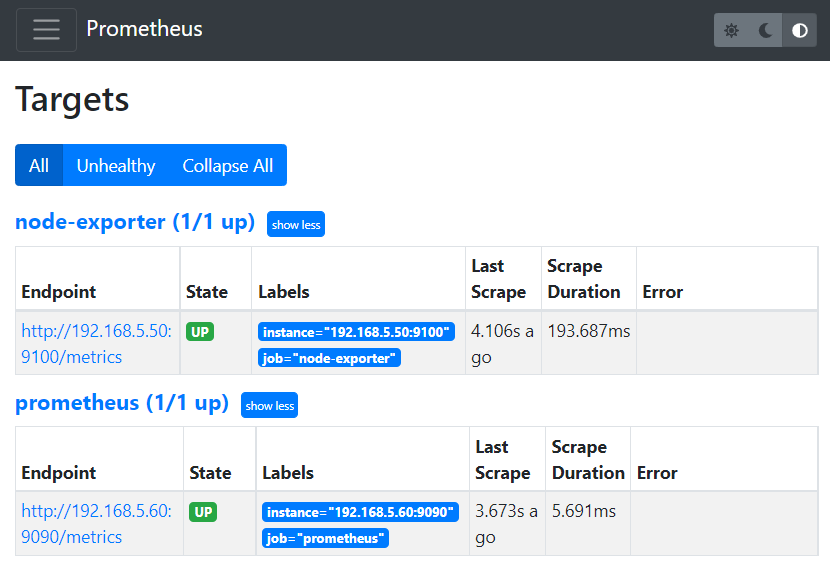
http://192.168.5.60:9090/targets
The result should look similar to this:
The last step is to configure Grafana which can be used for analytics and visualization which is going to be done in the article:
Linux Monitoring with Prometheus and Grafana Part 2
Resources
- https://prometheus.io/
- https://prometheus.io/docs/guides/node-exporter/
- Deeper look at how Prometheus Monitoring works, check TechWorld with Nana's video: https://www.youtube.com/watch?v=h4Sl21AKiDg

