Linux Monitoring with Prometheus and Grafana Part 2
After setting up the Prometheus node exporter and the Prometheus instance in Part 1, the next part of the journey is to setup Grafana to be able to visualize and analyze the metrics that are being collected by Prometheus.
Installing and configuring Grafana
There are two prerequisite packages that are needed by Grafana which are adduser and libfontconfig1.
You can install them with the following command:
sudo apt-get install -y adduser libfontconfig1 The version of Grafana that I am installing is version 8.1.2 which can be downloaded by running the following command:
wget https://dl.grafana.com/enterprise/release/grafana-enterprise_8.1.2_amd64.deb -P ~/grafana
After downloading Grafana, we need to change directory into the recently created Grafana's directory and run the command to install the Grafana's package, as follow:
cd grafana/
sudo dpkg -i ~/grafana/grafana-enterprise_8.1.2_amd64.deb
After installing Grafana, in order to enable and start the Grafana's service, run the following commands:
sudo systemctl enable grafana-server
sudo systemctl start grafana-server
Bringing Prometheus and Grafana Together
Once Grafana is installed, the next step is to go to the Grafana portal. If the default Grafana's configuration is not changed, the port that Grafana will be using is port 3000. In my case, I can access Grafana by entering the following in a browser: http://[You_IP_Address]:3000/login
There are different ways how Grafana Dashboard and metrics visualization can be setup. One way is to completely start fresh and build the different panels for your dashboard. Another way is to use one of the Grafana's templates available for Prometheus, and you also have the option to upload a JSON file template that is already configured with the setting that you are looking for.
In this case, I will start fresh and build the different visualization metrics that will monitor the following:
- CPU
- Memory
- Network Traffic
- Disk
The default Grafana's username and password is admin for both. Grafana will prompt you to change the password after you log in.
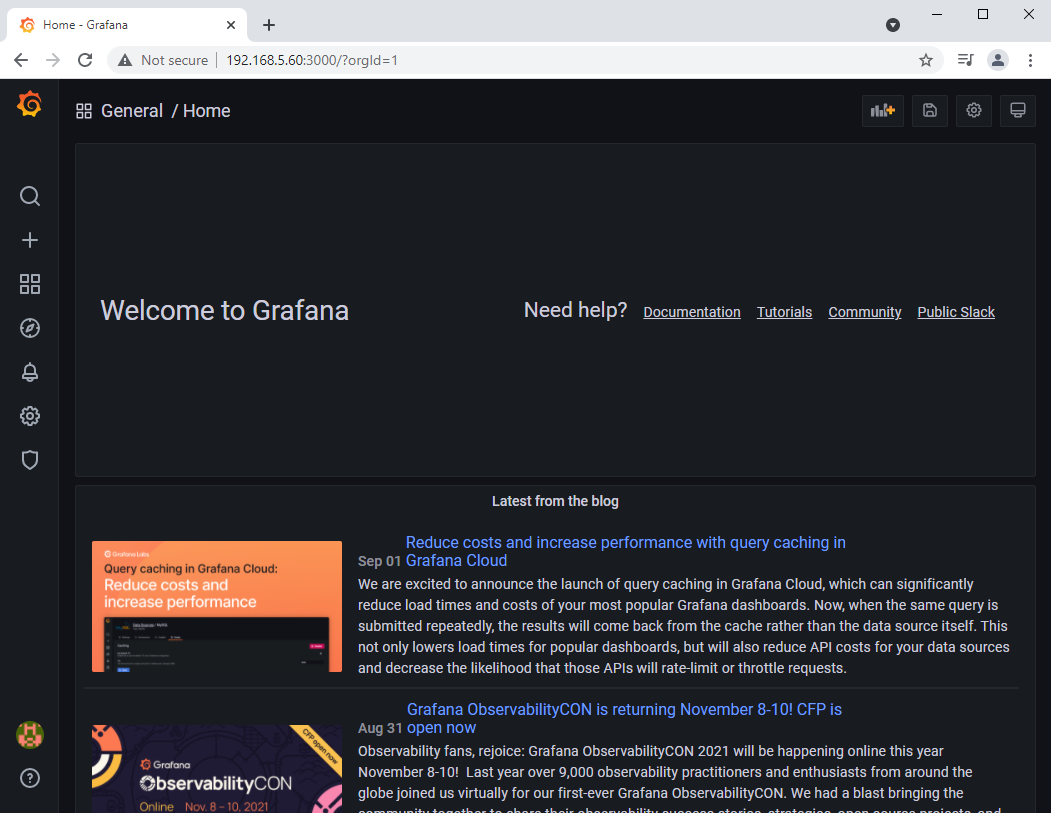
When you log into Grafana, it will take you to the Grafana Welcome page. From there, we will have to add the data source, in this case Prometheus.
Adding a Data Source to Grafana
Click on the Gear for configuration and then click on Data Sources. After that click on Add data source and click on Prometheus. In the Data Sources page, enter the name (mine is Prometheus-Server) and then enter the URL (mine is http://192.168.5.60:9090) and then click on Save & test.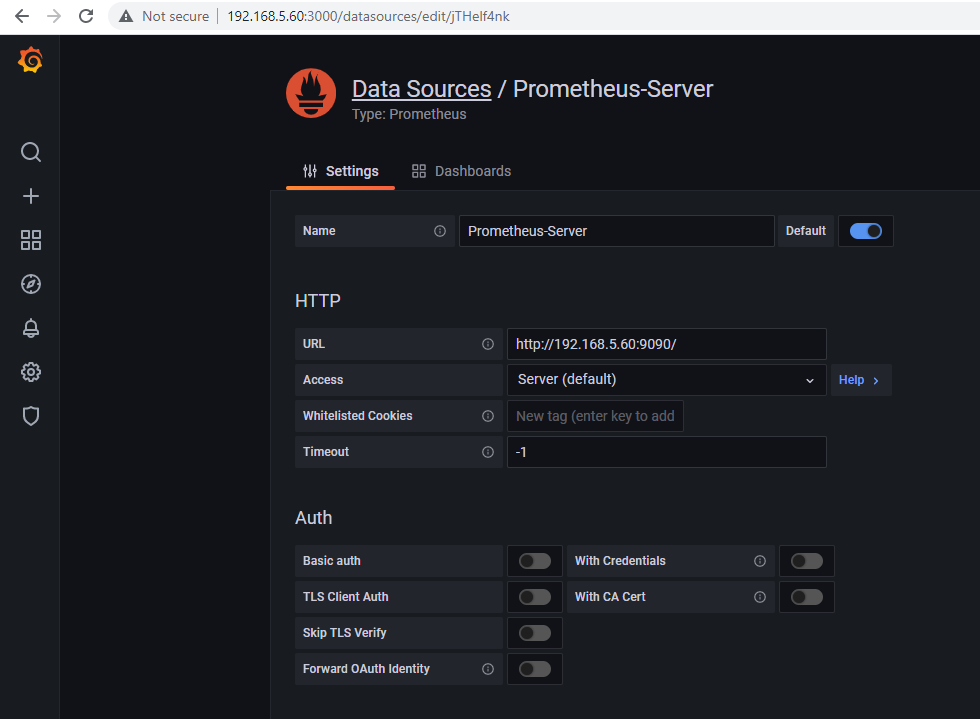
Creating a dashboard
After adding the data source, the next step is to create a dashboard. We can do this by clicking on the Plus sign (+) and then clicking Dashboard.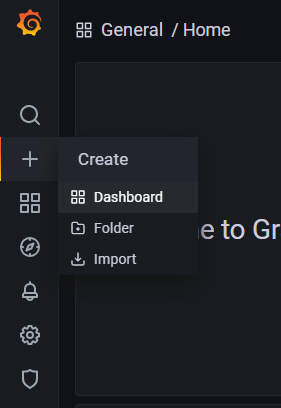
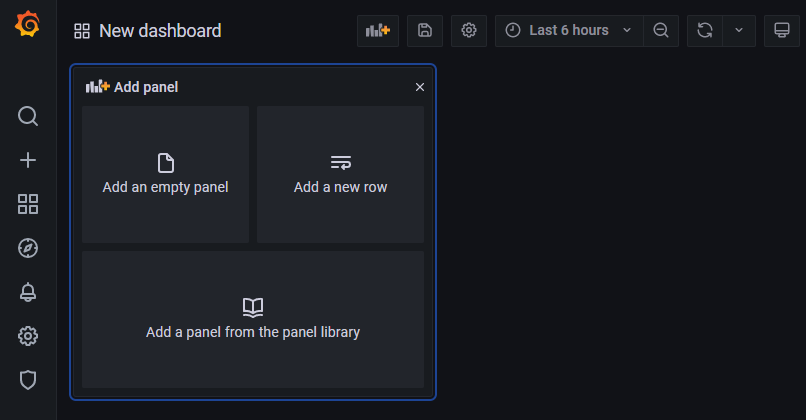
From there, we have to option to add panel form the panel library; however, we are starting from the beginning and creating the panels ourselves. We are going to select Add an empty panel. This will take us to the option to edit the panel.
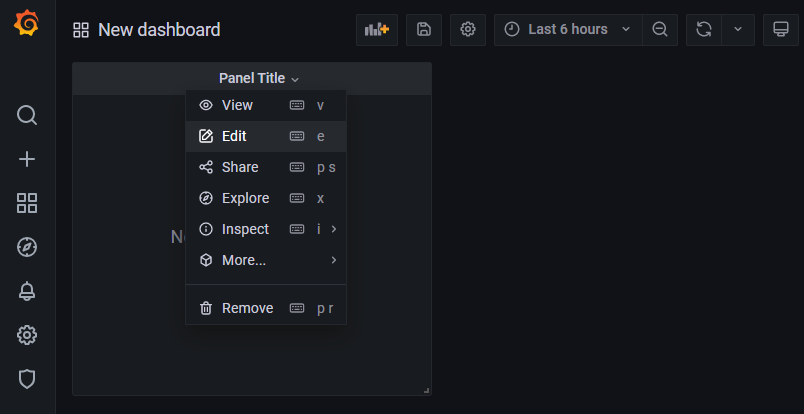
Click on Panel Title and then click on Edit.
Adding Metrics
As noted above, the only metrics that I am interested in are CPU, memory, and disk usage and network traffic. In addition, the network traffic that is being monitored is for the wlan0 interface because that is the WLAN port of the firewall/router. However, we can add both interfaces (wlan0 and eth0) if need be.
Network Traffic
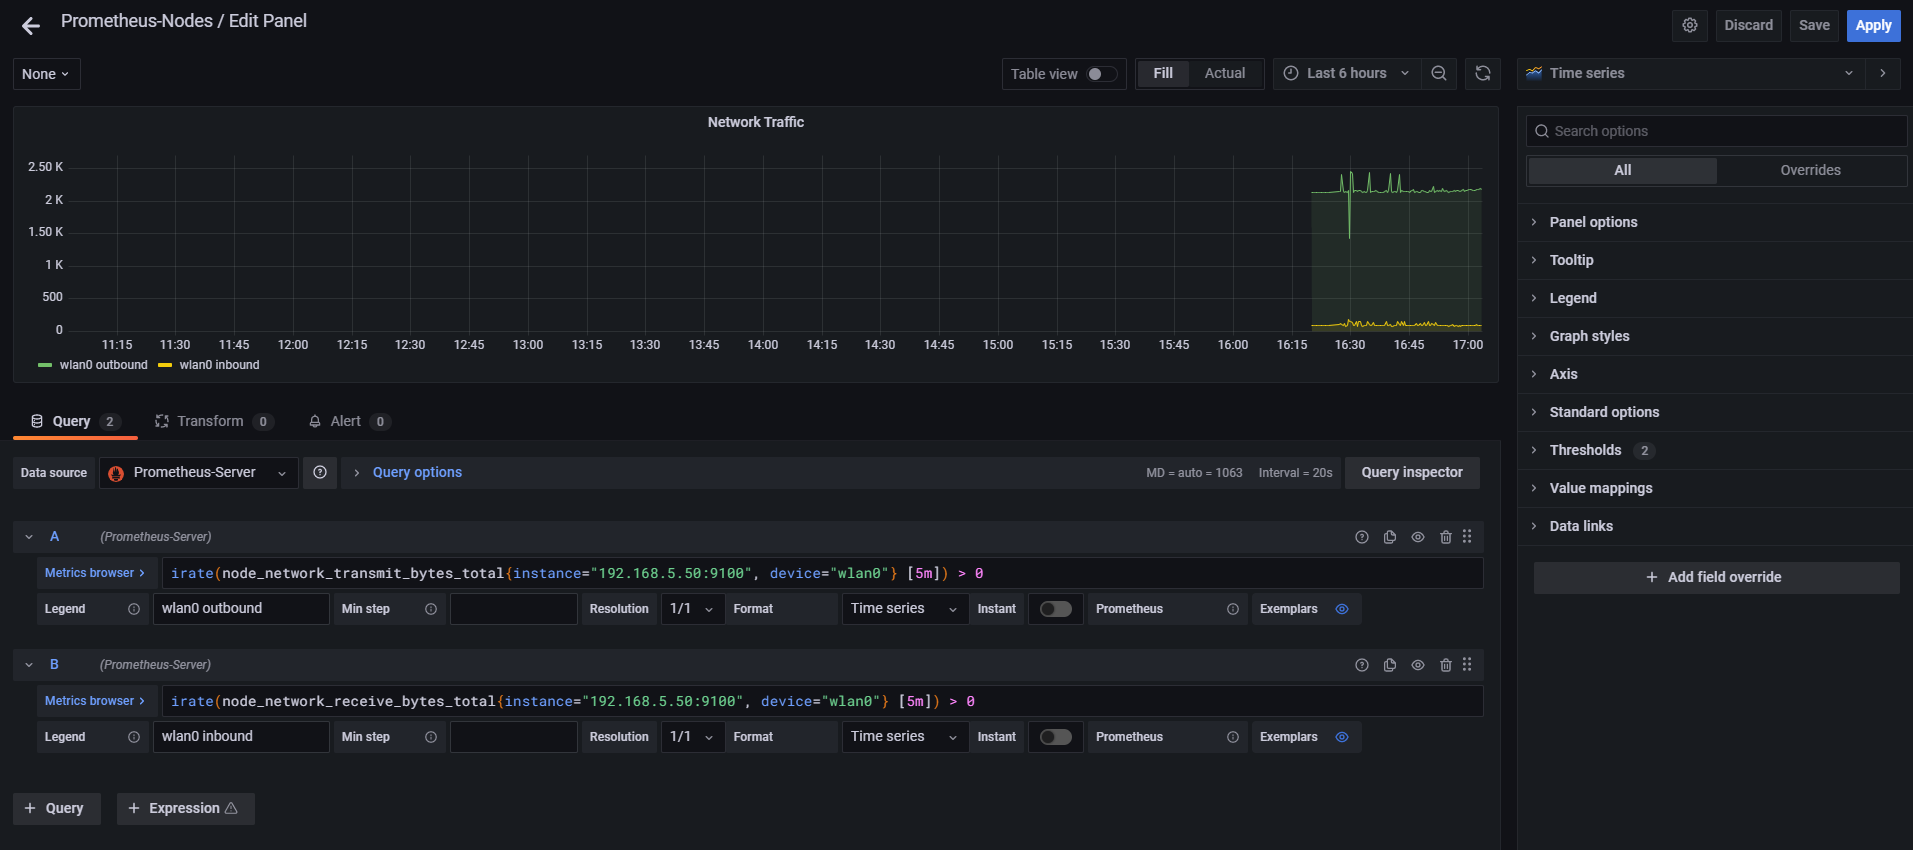
The following is the configuration and PromQL query that I am using for the Network Traffic Panel:- Panel's title is Network Traffic
- The visualization is Timeseries
We will be monitoring outbound and inbound traffic. For the Legend of the outbound traffic is wlan0 outbound, and the PromQL query for outbound traffic is:
For the Legend of the outbound traffic is wlan0 inbound, and the PromQL query for inbound traffic is:
In the right hand side, we have the Option pane where there are the different tools that can be used to change the Panel Options, Display, Series overrides, Axes Thresholds (note that these options will change depending the visualization chosen).
Network State - Up/Down
The following is the configuration and PromQL query that I am using for the Network State :- Panel's title is Network State
- The visualization is Stat
The Legend is wlan0, and the PromQL query for the network state is:
Disk Usage
The following is the configuration and PromQL query that I am using for the Disk Usage:- Panel's title is Disk Usage
- The visualization is Pie chart
The Legend is Free_Space, and the PromQL query for the free disk space is:
The Legend is Used_Space, and the PromQL query for the used space in the disk is:
CPU Usage
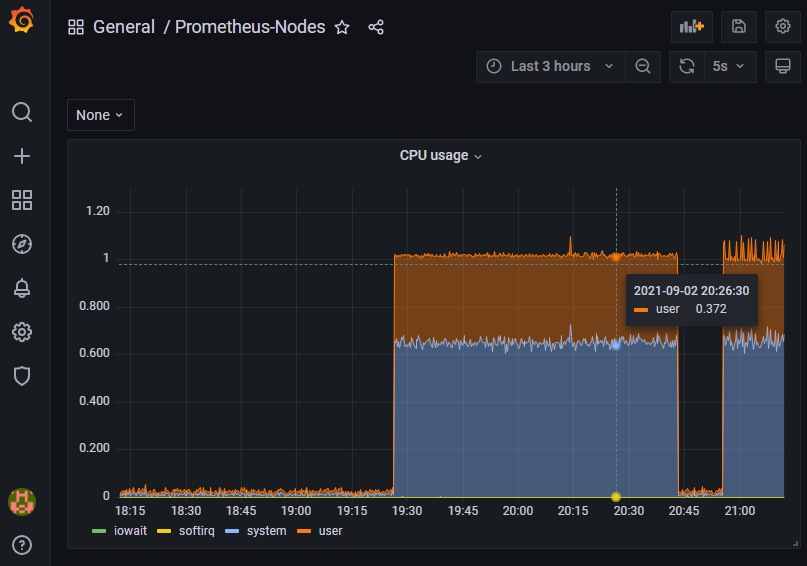
The following is the configuration and PromQL query that I am using for the CPU usage:- Panel's title is CPU Usage
- The visualization is Time series
The Legend is {{mode}}, and the PromQL query for the CPU usage is:
Memory Usage
The following is the configuration and PromQL query that I am using for the Memory usage:- Panel's title is Memory Usage
- The visualization is Graph (old)
The Legend is Buffers, and the PromQL query for the buffer memory is:
The Legend is Cached, and the PromQL query for the cached memory is:
The Legend is Free, and the PromQL query for the free memory is:
The Legend is Cached, and the PromQL query for total memory in used is:
The following image is the final configuration of the Network Traffic's panel:
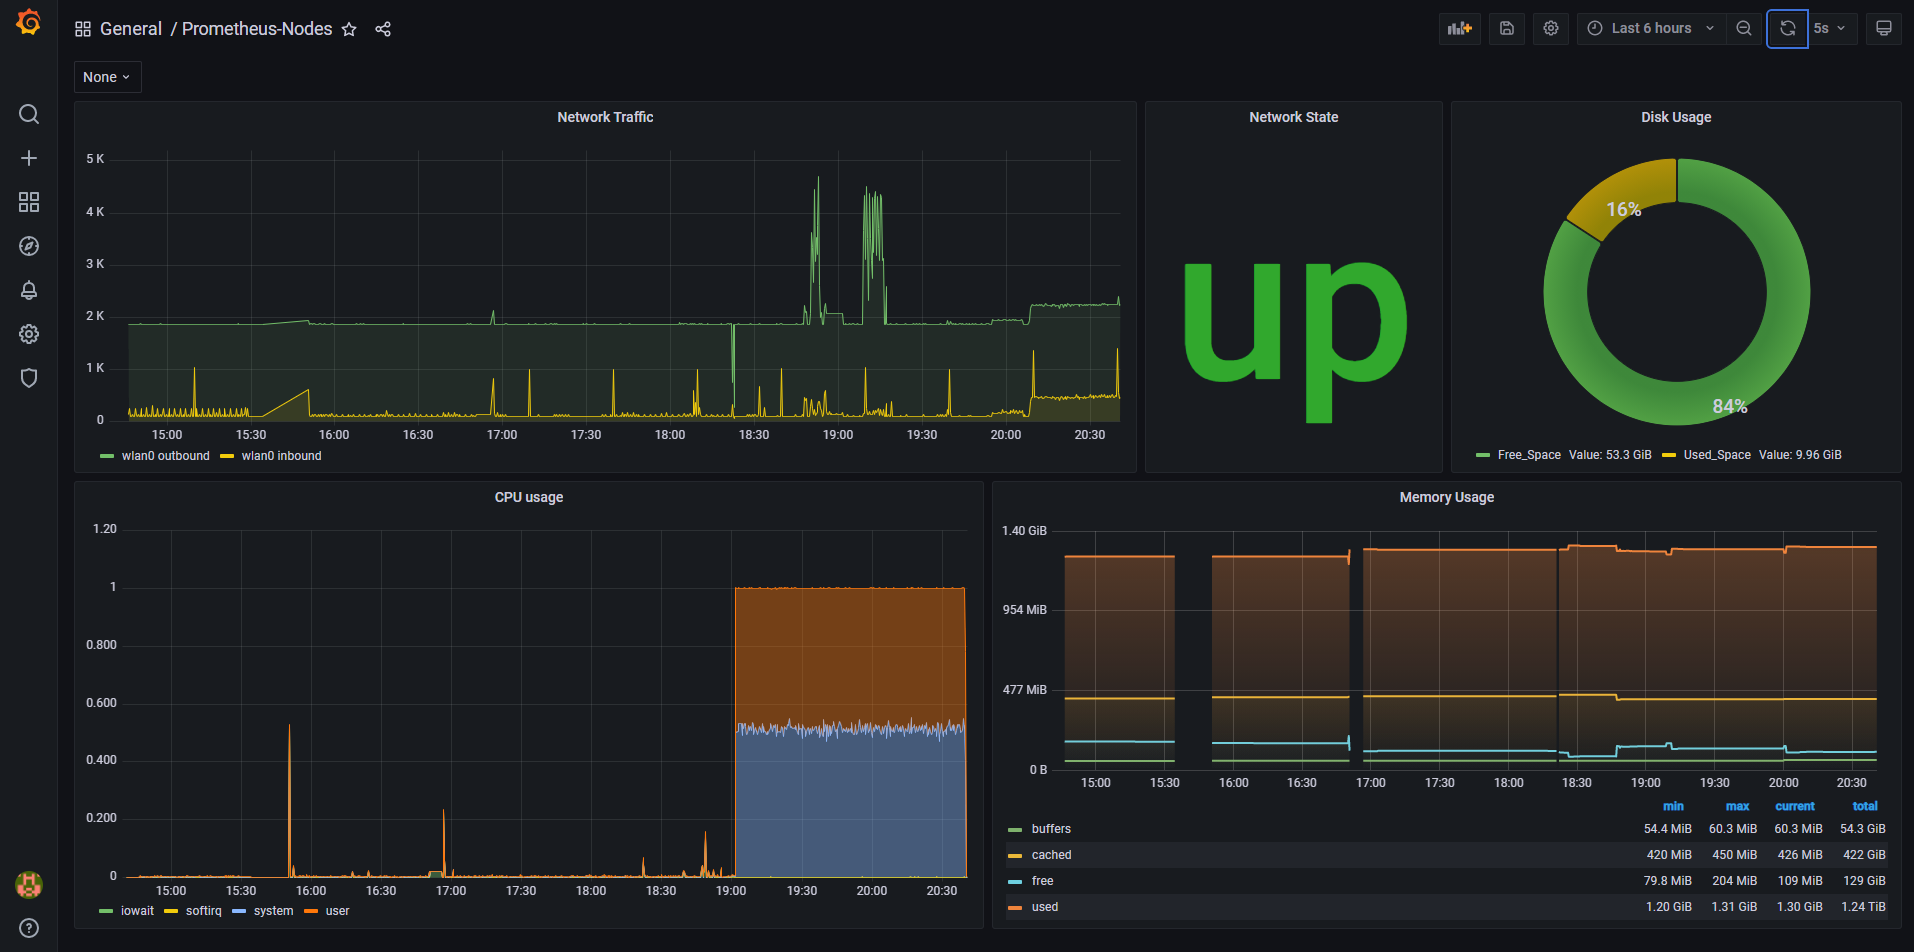
After configuring all the panels, the final dashboard will look as follow:
Resources
